|
Ant Script Visualizer
Using Ant Script Visualizer
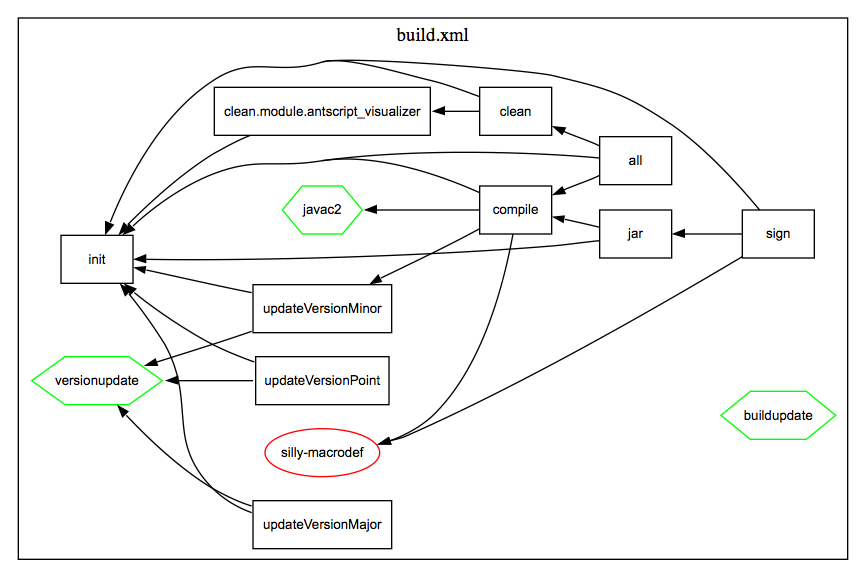
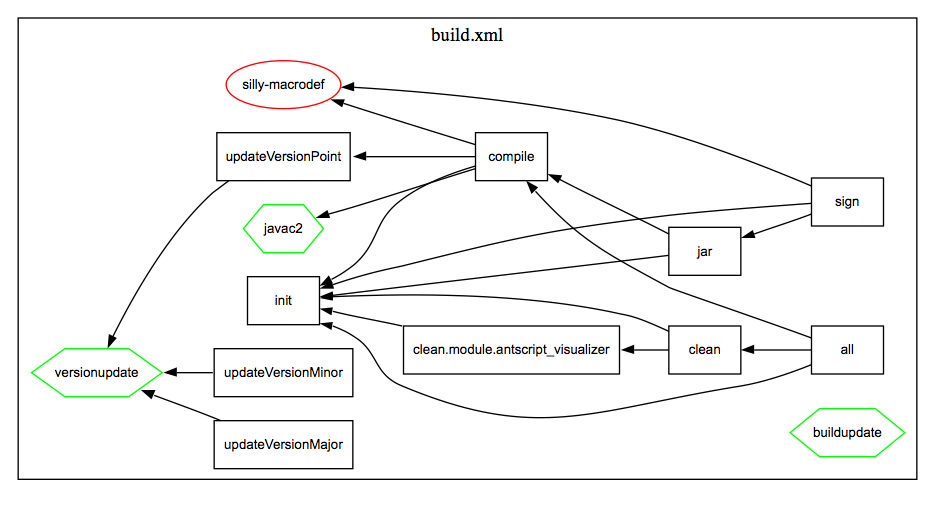
If you fired up the program, and accepted all the defaults (show targets, imports, taskdefs, and macrodefs) and then pointed it at the build script used to build this application, you'd get something like the following:
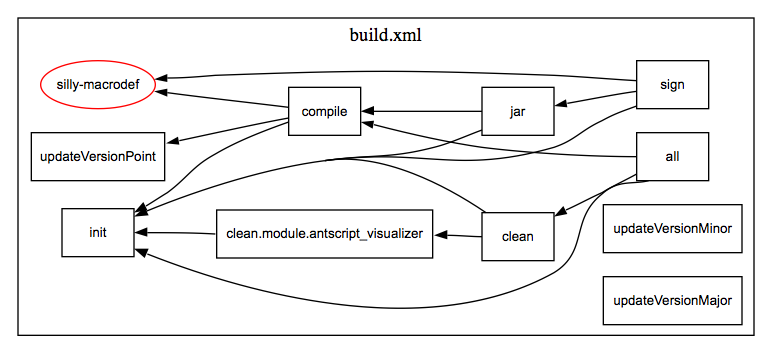
If you just wanted to see how the macrodefs were used (uncheck everything except "Show targets" and "Show macrodefs"), you'd get:
Quite a different picture, eh? You can plainly see who's using the macrodef "silly-macrodef"
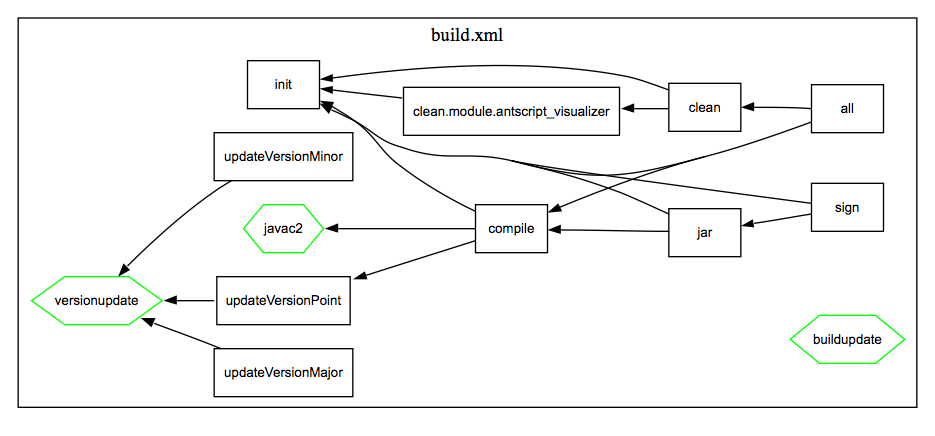
Now, just selecting "Show taskdefs" will give us:
Again, you can plainly see that the javac2 taskdef is used by the compile target
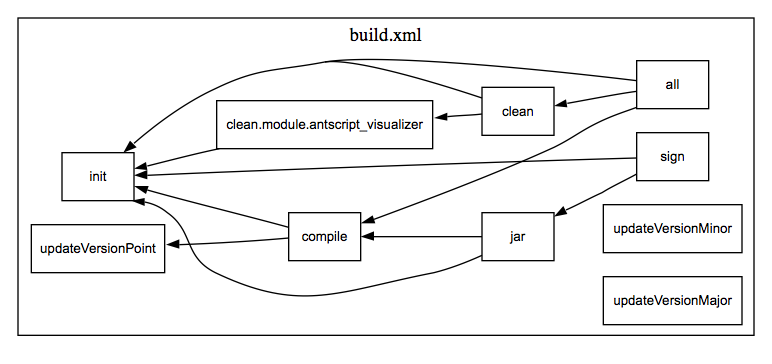
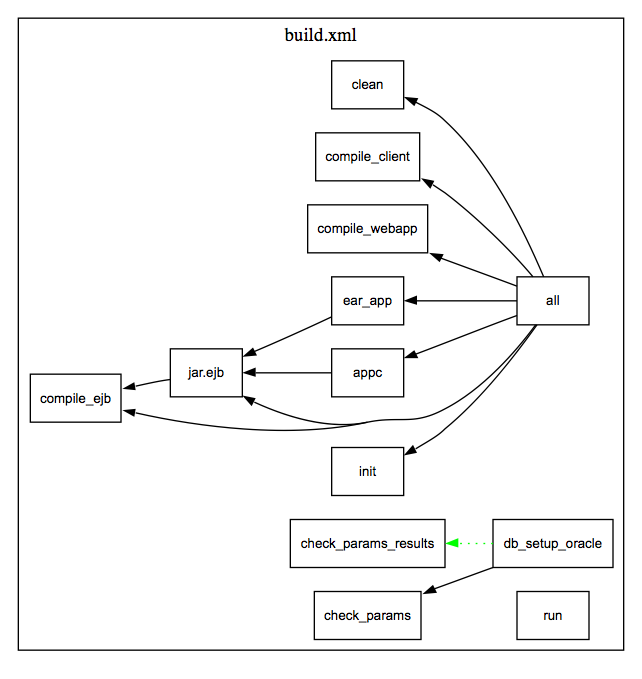
Now, just selecting "Show targets" gives us:
The options available are:
- Import options
- Show macrodefs - Any macrodef dependencies in your files will be shown as red ellipses.
- Show taskdefs - Any taskdef dependencies in your files will be shown as green hexagons.
- Show targets - Any target dependencies in your files will be shown as black rectangles.
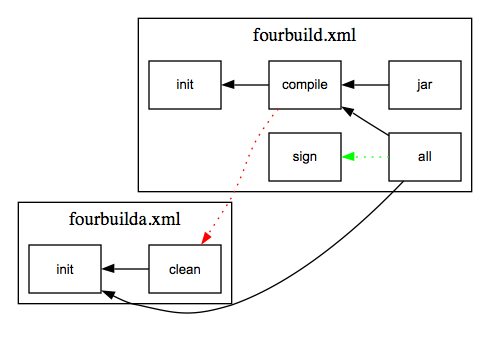
- Show Ant and Antcalls - Any calls to other targets via ant or antcall tasks will be included. Ant and Antcalls show as red and green dotted lines, respectively. Here's an example:
- Include imported Ant files - If your Ant files have an <include file="filename.xml"/> in them, they will be sucked in and analyzed as well (and, any imports those files have will also be imported.
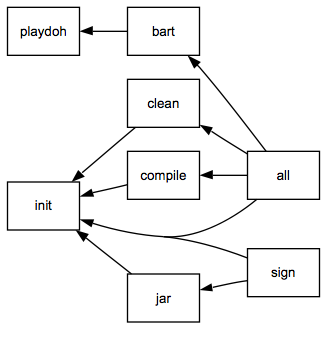
- Group nodes by buildfiles - If this is unchecked, all nodes are displayed as cleanly as possible, like so:
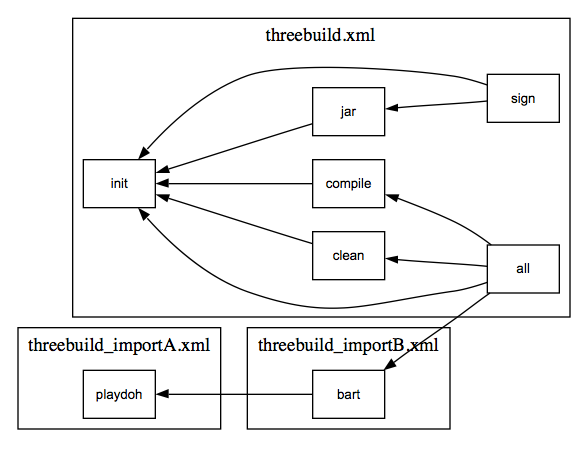
If it's checked, the nodes are grouped by what file they are in (which will be labeled and bounded by a rectangle), like so:
This will look considerably messier, but it's convenienent to know what targets are in what files.
- Concentrate lines - Where possible, two lines close together going to the same target will be merged (think of an on-ramp for a freeway). This can clean up a graph considerably. For example no concentrating:
and concentrating:
- Delete dot files on exit - This should normally be left checked - it lets the program clean up after itself when done. The program generates temporary ".dot" files which Graphviz uses to generate the actual graphs.
- Output formats
- PNG - Portable Network Graphics, usable almost everywhere
- PDF - Alas, available only if you're running this on a Mac. Pity, it's the best-looking format for output.
- SVG - Scalable Vector Graphcis. This also looks great, but there is very, very little support for it.
Other features worth noting:
- You can select multiple files at once. Each file selection will get it's own graphic file exported.
- Graphic files are exported to the same directory as the .xml files.
- The program "remembers" the directory where it was pointed, and will go there the next time it's started.
- If you're running this on a PC or Mac (OS X, anyway), the graphic image will open up in your system's default viewer after it's generated.
These examples may seem trivial, but here's an exmple of the results of a real script (taken from BEA's sample directgory, shown with all imports and options on):
|